Port Performance
Keep your finger on the pulse of the port. We would like to assist you in getting a clearer picture of how well the port is operating and the detailed workings of port activities. With this information, you can make better plans and improve communication.
This page is regularly updated with relevant developments and information. Stay updated with news relating to port performance and other developments in the logistics chain.
Anchorage
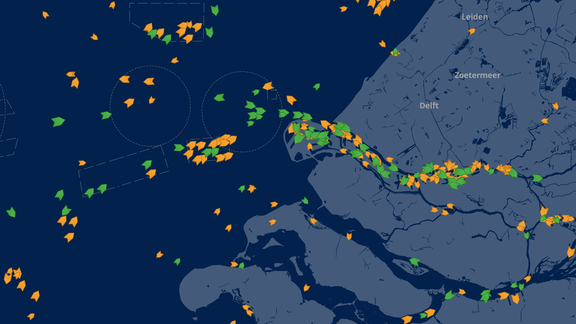
Anchorage performance monitors ships waiting to enter the Port of Rotterdam. Ships stop in special zones called anchorage areas for various reasons. Monitoring these areas is important to measure how busy the port is and how timely the shipping schedules are. It also helps encourage ships to arrive just-in-time, which means they can start port entry processes within less than 3 hours. This approach aims to reduce unnecessary waiting times and the emissions caused by ships idling at anchor. Source: Eesea AIS data
Container Vessel Port Calls In Rotterdam
Container Vessels at Anchorage ( % )
Average waiting time at anchorage - Deepsea
Average waiting time at anchorage - Feeder (Short Sea)
Container Throughput
Container throughput: Containers are measured in Twenty Foot Equivalent units (TEU), general containers are often two sizes. A 20 foot container is considered one TEU and a 40 foot container is two. At the port of Rotterdam a TEU is exchanged roughly every 3 seconds. This measurement helps you keep an eye on the patterns and changes in container movement, giving you a clear view of the amounts handled every quarter, divided into different groups. Source: Port dues / Port of Rotterdam
Total TEU
Jan 2025 - Dec 2025
00 M
YTD diff: 00%
TEU 2022: 00 M
Import: -4,5 %
Export: 4,1 %
Empty: -4,5 %
Full: 4,1 %
Deep Sea: 2,193,385
Short Sea: 1,051,588
No Liner Service: 53,534
TEU Throughput
Intra-port efficiency
The Rotterdam port area stretches over 40 km, with approximately 75 seagoing vessel visits and 245 inland vessel visits daily. This section gives insight into the terminal and vessel container operations in the port area. Vessel Turnaround Time (VTT) in Port measures the average time it takes for a vessel to move from the sea, through the Nieuwe Waterweg, to a one or multiple berths, before returning back out of the port area at Maasvlakte. It’s calculated for all seagoing container ships visiting the port. VTT at Berth monitors how long a ship stays at a specific berth, from the moment it arrives until it leaves. Data source: Port dues & AIS / Port of Rotterdam Authority (only tracks container ships not general cargo type vessels)
Connections
Deepsea liner service connections show the specific schedules of international ships that stop at major ports in Northwestern Europe. The first port of call is important because it ensures that incoming goods reach the final customers quickly. The last port of call is key for European exporters because it allows them to send their goods on the most direct path to their destination. Data Source: Eesea
Deep Sea Liner Services
First Port of Call Rotterdam
30
Difference with last year: -4
Last Port of Call Rotterdam
9
Difference with last year: 2
Please note:
- This dashboard only includes data associated to container trade.
- Year-to-date (YTD) figures offer a comparison to the same period the year prior.
- All dashboard data will be updated the first week of each month.
Barge Performance Monitor
Rotterdam is working with its partners on reliable and efficient connections between the port and destinations in the hinterland. For inland container shipping sailing to or from the port of Rotterdam, we have developed the Barge Performance Monitor.
SHIPTRACKER
The Port of Rotterdam Authority wants to provide insight into the efficiency of container handling in the port by drafting, measuring and publishing performance indicators. To provide such insight, data sharing between all chain parties is essential.
